
The Ichimoku Cloud, or Ichimoku Kinko Hyo, is a comprehensive technical analysis tool that has gained significant popularity among traders worldwide. Developed in the late 1930s by Japanese journalist Goichi Hosoda, the Ichimoku Cloud provides a multifaceted view of the market, offering insights into price momentum, trend direction, and potential support and resistance levels.
The Basics of Ichimoku Cloud
The Ichimoku Cloud is a complex yet intuitive tool that offers a multi-dimensional view of the market. Each component plays a specific role, and their interactions provide valuable insights for traders.
- Tenkan-sen (Conversion Line): This line represents the midpoint of the highest high and the lowest low over the past nine periods. It’s a faster-moving indicator, often used to identify short-term momentum. When the Tenkan-sen crosses over the Kijun-sen, it’s a potential signal for market movement.
- Tenkan-sen = [Highest High (9 periods)+Lowest Low (9 periods)]/2
- Kijun-sen (Base Line): Calculated as the midpoint of the highest high and the lowest low over the past 26 periods, the Kijun-sen is a slower-moving line compared to the Tenkan-sen. It reflects the medium-term trend and can serve as a support or resistance level.
- Kijun-sen = [Highest High (26 periods)+Lowest Low (26 periods)]/2
- Senkou Span A (Leading Span A): The average of the Tenkan-sen and the Kijun-sen, plotted 26 periods ahead, forms the first boundary of the cloud. This forward projection helps traders anticipate potential areas of support or resistance in the future.
- Senkou Span A = [Tenkan-sen+Kijun-sen]/2
- Senkou Span B (Leading Span B): Representing the midpoint of the highest high and the lowest low over the past 52 periods, plotted 26 periods ahead, Senkou Span B forms the second boundary of the cloud. It moves slower than Senkou Span A, offering a longer-term perspective.
- Senkou Span B = [Highest High (52 periods)+Lowest Low (52 periods)]/2
- Chikou Span (Lagging Span): The current closing price plotted 26 periods behind, the Chikou Span provides a historical context. Its position relative to the price action offers insights into market sentiment.
- Chikou Span = Closing Price (plotted 26 periods behind)
The interaction between these components, especially within the cloud formed by Senkou Span A and B, is critical for traders. The cloud’s thickness can indicate the market’s strength or weakness. A thicker cloud suggests stronger support or resistance, making it harder for the price to break through. Conversely, a thinner cloud indicates weaker support or resistance, suggesting the price might easily penetrate it.
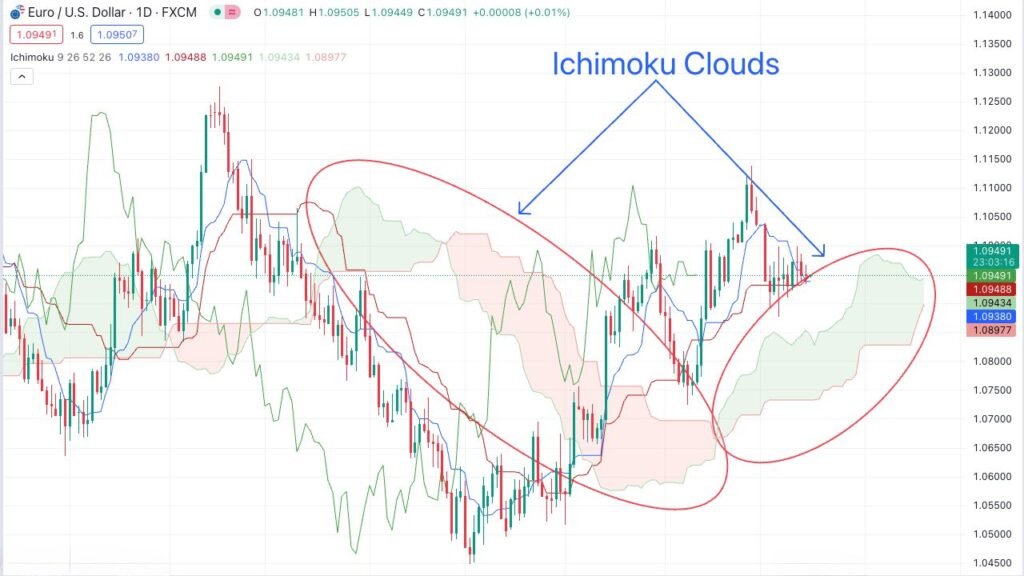
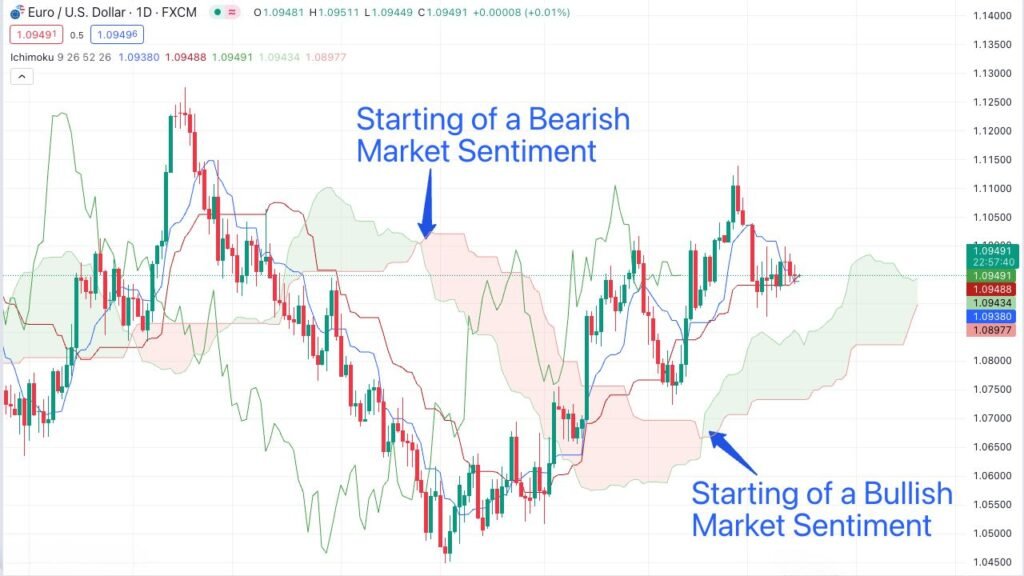
Traders often look for the cloud’s colour changes as signals for potential trend reversals. When Senkou Span A crosses above Senkou Span B, the cloud turns green, indicating a bullish trend. If Senkou Span A crosses below Senkou Span B, the cloud turns red, signaling a bearish trend.
The Ichimoku Cloud’s comprehensive approach combines multiple elements to provide a thorough analysis of market trends, momentum, and potential support and resistance levels. By understanding how these components interact, traders can make more informed decisions and develop strategies aligned with market dynamics.
Advanced Techniques and Strategies
To effectively utilize the Ichimoku Cloud, traders often combine these components to identify potential buy or sell signals. A deep understanding of the signals and the context in which they occur is crucial for successful trading.
Bullish Signals: There are several indicators within the Ichimoku system that suggest a bullish trend. One of the primary signals is a price move above the cloud, which indicates that the overall market sentiment is bullish. Another bullish signal is when the Tenkan-sen (Conversion Line) crosses above the Kijun-sen (Base Line). This crossover is often seen as a strong buy signal, especially when it takes place above the cloud. The Chikou Span (or Lagging Span) also adds important confirmation, when it’s positioned above the current price, it reinforces the presence of bullish momentum.
Bearish Signals: In contrast, bearish trends are identified by opposite signals. A price move below the cloud suggests that sellers are dominating the market, indicating a bearish outlook. A Tenkan-sen crossing below the Kijun-sen, especially below the cloud, is seen as a sell signal. Moreover, when the Chikou Span is below the price, it reinforces the bearish sentiment.
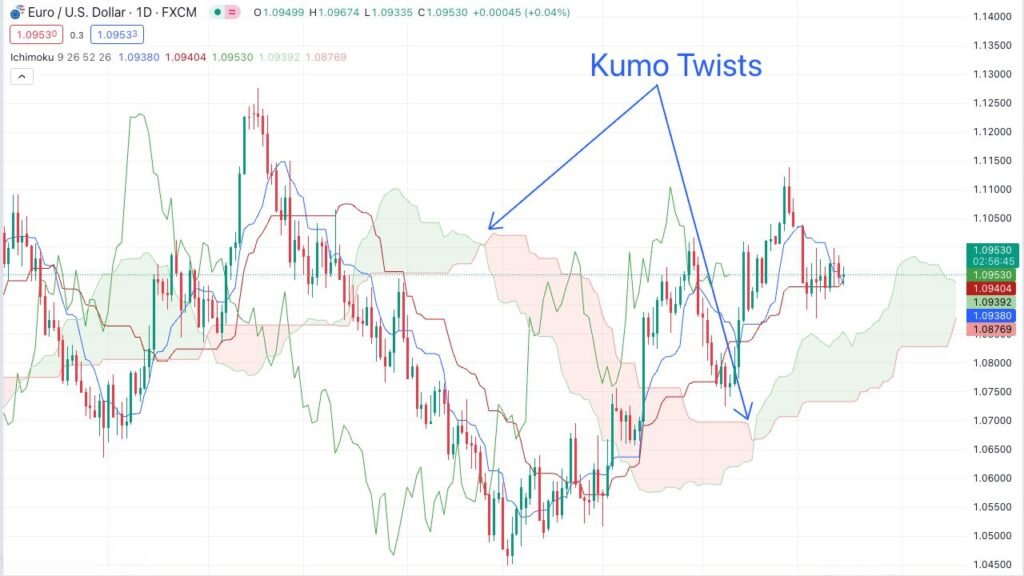
Beyond these basic signals, the Ichimoku Cloud offers more nuanced techniques for traders. One such technique is observing the “Kumo Twist,” a scenario where Senkou Span A crosses over Senkou Span B. This crossover, particularly when it happens within the cloud, can indicate a potential trend reversal. A Kumo Twist from red to green suggests a shift from bearish to bullish sentiment, while a change from green to red implies a move from bullish to bearish sentiment.

Traders also pay attention to the cloud’s thickness, as it can serve as an indicator of market volatility and strength. A thicker cloud implies stronger support or resistance, suggesting that the price might find it more challenging to break through. In contrast, a thinner cloud indicates weaker support or resistance levels, potentially allowing for easier price penetration.
Another advanced strategy involves combining the Ichimoku Cloud with other technical indicators, such as Moving Averages, Relative Strength Index (RSI), or Bollinger Bands. This approach can provide additional confirmation of signals and help traders refine their entry and exit points.
Combining Ichimoku Cloud with Moving Averages
Moving averages are a popular tool to identify the trend direction and potential reversal points. A simple strategy is to use a moving average (like the 50-day or 200-day moving average) alongside the Ichimoku Cloud.
Example: If the price is above both the Ichimoku Cloud and the 200-day moving average, it indicates a strong bullish trend. A trader might consider this a confirmation of a long position. Conversely, if the price is below both the cloud and the moving average, it suggests a strong bearish trend, potentially signaling a short position.
Combining Ichimoku Cloud with Relative Strength Index (RSI)
The RSI is a momentum oscillator that measures the speed and change of price movements, typically on a scale of 0 to 100. It can help identify overbought or oversold conditions.
Example: Consider a scenario where the Ichimoku Cloud shows a bullish trend (price above the cloud), but the RSI is above 70, indicating an overbought market. This could suggest that the bullish trend might soon pause or reverse, prompting a trader to be cautious about entering a long position or to consider taking profits if they are already in a long position.
Combining Ichimoku Cloud with Bollinger Bands
Bollinger Bands consist of a middle band being a moving average and two standard deviation bands above and below this middle band. They are useful for identifying the volatility and potential ‘overbought’ or ‘oversold’ conditions.
Example: In a situation where the price is above the Ichimoku Cloud (indicating a bullish trend) and also touching or breaking above the upper Bollinger Band, it might signal that the market is in an overbought condition. A trader might interpret this as a signal to be prepared for a potential pullback or reversal. Alternatively, if the price is below the cloud and touches or breaks below the lower Bollinger Band, it might indicate an oversold condition, suggesting a potential bounce back or reversal to the upside.
It’s important to note that while the Ichimoku Cloud offers a comprehensive set of tools for market analysis, it is not infallible. Market conditions, news, and other external factors can influence price movements. Therefore, traders should use the Ichimoku Cloud in conjunction with sound risk management practices, including setting stop-loss orders and taking profits at appropriate levels. By understanding and applying these advanced techniques and strategies, traders can leverage the Ichimoku Cloud to make more informed and strategic trading decisions.
Practical Applications and Case Studies
The Ichimoku Cloud’s versatility makes it an invaluable tool for traders in various markets, including stocks, forex, commodities, and even the burgeoning cryptocurrency market. Its adaptability to different market conditions and timeframes allows traders to develop strategies tailored to their specific needs and risk tolerance.
In the stock market, the Ichimoku Cloud is instrumental in assessing the strength of trends and identifying potential reversal points. Crossovers of the Tenkan-sen and Kijun-sen provide early signals of trend changes, while the cloud delineates support and resistance levels. For instance, a stock trading above a green cloud suggests a strong uptrend, presenting opportunities to buy on pullbacks to the cloud.
Forex market traders leverage the Ichimoku Cloud’s capabilities to capture trends across various currency pairs. Given the market’s high liquidity and 24-hour trading cycle, the Ichimoku Cloud assists in identifying breakout trades and confirming the continuation of existing trends. The Chikou Span is particularly useful in validating the legitimacy of a breakout.
Commodity and Cryptocurrency Markets
In commodity trading, particularly in volatile markets like oil and gold, the Ichimoku Cloud provides insights into long-term trends and potential reversals. These markets, often swayed by geopolitical and economic factors, benefit from the cloud’s ability to signal trend strength and reversal points.
The cryptocurrency market, known for its high volatility and rapid price movements, also finds the Ichimoku Cloud useful. Traders utilize the tool to identify strong trends and establish potential buy and sell points, crucial in navigating the crypto market’s dynamic environment.
Case studies of the Ichimoku Cloud demonstrate its effectiveness across different market scenarios. During a strong uptrend, the cloud acts as a dynamic support area, offering opportunities for buying dips. Traders often wait for the price to touch or slightly penetrate the cloud and then rebound as a signal for a long position entry. Conversely, in a downtrend, the cloud becomes a resistance area, with short-selling opportunities arising when the price touches or penetrates the cloud from below before falling back.
The Ichimoku Cloud also helps identify consolidations and breakouts. When the price trades within the cloud, it typically indicates a consolidation phase, and a breakout from the cloud can herald the start of a new trend. This knowledge allows traders to position themselves strategically for potential significant market moves.
While the Ichimoku Cloud provides substantial insights, it is best used in conjunction with other technical indicators and fundamental analysis to validate trading decisions. Moreover, effective risk management, including setting appropriate stop-loss orders and establishing clear exit strategies, is crucial in safeguarding against market volatility and unforeseen events. By understanding these applications and learning from case studies, traders can successfully integrate the Ichimoku Cloud into their trading strategies, enhancing their proficiency in navigating diverse market conditions.
Common Mistakes and Misconceptions
When using the Ichimoku Cloud, traders often fall into several common pitfalls and misconceptions that can hinder their trading performance. Understanding these mistakes is crucial for effective and successful trading.
Overreliance on the Ichimoku Cloud: One of the most common mistakes is relying exclusively on the Ichimoku Cloud without considering market fundamentals or other technical indicators. While the Ichimoku Cloud is a comprehensive tool, it should not be used in isolation. The financial markets are influenced by a myriad of factors, including economic indicators, political events, and company news. Ignoring these elements can lead to misguided decisions. Additionally, integrating other technical analysis tools, such as moving averages, RSI, or MACD, can provide a more holistic view and validate the signals generated by the Ichimoku Cloud.
Misinterpretation of Signals: Another mistake is the misinterpretation of the Ichimoku Cloud’s signals. Traders sometimes misread the crossover signals or the cloud’s color changes, leading to premature or incorrect trading decisions. It’s important to understand the context in which these signals occur. For example, a bullish signal in a strong downtrend might merely indicate a short-term correction rather than a trend reversal.
Ignoring the Timeframe: The effectiveness of the Ichimoku Cloud can vary significantly across different timeframes. Some traders mistakenly apply the same interpretation of the cloud’s signals on a 5-minute chart as they would on a daily chart. It’s vital to adjust the analysis to the specific timeframe and trading strategy.
Neglecting Risk Management: Perhaps the most critical oversight is neglecting proper risk management practices. No technical analysis tool, including the Ichimoku Cloud, can guarantee success in trading. The markets are inherently unpredictable, and various external factors can impact price movements. Therefore, implementing sound risk management strategies, such as setting stop-loss orders and having a clear risk-to-reward ratio, is essential. This practice helps in mitigating potential losses and protecting trading capital.
Lack of Trading Discipline: Trading discipline is another key aspect often overlooked by traders using the Ichimoku Cloud. Succumbing to emotions like greed or fear can lead to irrational trading decisions, such as chasing losses or exiting profitable trades prematurely. Maintaining a disciplined approach, adhering to a trading plan, and being patient are crucial for long-term success in the markets.
In summary, while the Ichimoku Cloud is a powerful tool for market analysis, it should be used as part of a broader trading strategy that includes an understanding of market fundamentals, integration with other technical indicators, proper risk management, and strict trading discipline. By avoiding these common mistakes and misconceptions, traders can more effectively leverage the Ichimoku Cloud to enhance their trading decisions and performance.
Conclusion
The Ichimoku Cloud strategy provides a dynamic and multifaceted approach to market analysis. While it offers valuable insights, successful trading requires practice, continual learning, and an understanding of market conditions. By mastering the Ichimoku Cloud, traders can enhance their ability to make informed decisions in the complex world of financial markets.
FAQ
The Ichimoku Cloud, also known as Ichimoku Kinko Hyo, is a comprehensive technical analysis tool used in trading. It combines multiple indicators to provide insights into market trends, momentum, and potential support and resistance levels.
The Ichimoku Cloud consists of five main components: Tenkan-sen (Conversion Line), Kijun-sen (Base Line), Senkou Span A (Leading Span A), Senkou Span B (Leading Span B), and Chikou Span (Lagging Span). Each component offers unique insights into market dynamics.
Trading signals are identified through the Ichimoku Cloud by analyzing the interactions between its components. Bullish signals include a price move above the cloud and the Tenkan-sen crossing above the Kijun-sen. Bearish signals are indicated by a price move below the cloud and the Tenkan-sen crossing below the Kijun-sen.
Yes, the Ichimoku Cloud is versatile and can be applied to various markets, including stocks, forex, commodities, and cryptocurrencies. It is adaptable to different timeframes and trading styles.
A “Kumo Twist” occurs when Senkou Span A crosses over Senkou Span B within the cloud, signaling a potential trend reversal. A twist from red to green indicates a shift from bearish to bullish sentiment, and vice versa.
Common mistakes include overreliance on the Ichimoku Cloud without considering other market factors, misinterpretation of signals, ignoring the appropriate timeframe, neglecting risk management practices, and lacking trading discipline.
Risk management is crucial when using the Ichimoku Cloud, as no technical analysis tool can guarantee success. Implementing strategies such as setting stop-loss orders and having a clear risk-to-reward ratio is essential to mitigate potential losses and protect trading capital.